
SiteMonitor Enterprise offers a variety of reports to be able to come up with concrete numbers of you site uptime and any performance issues on your website and/or host.
The reports are:
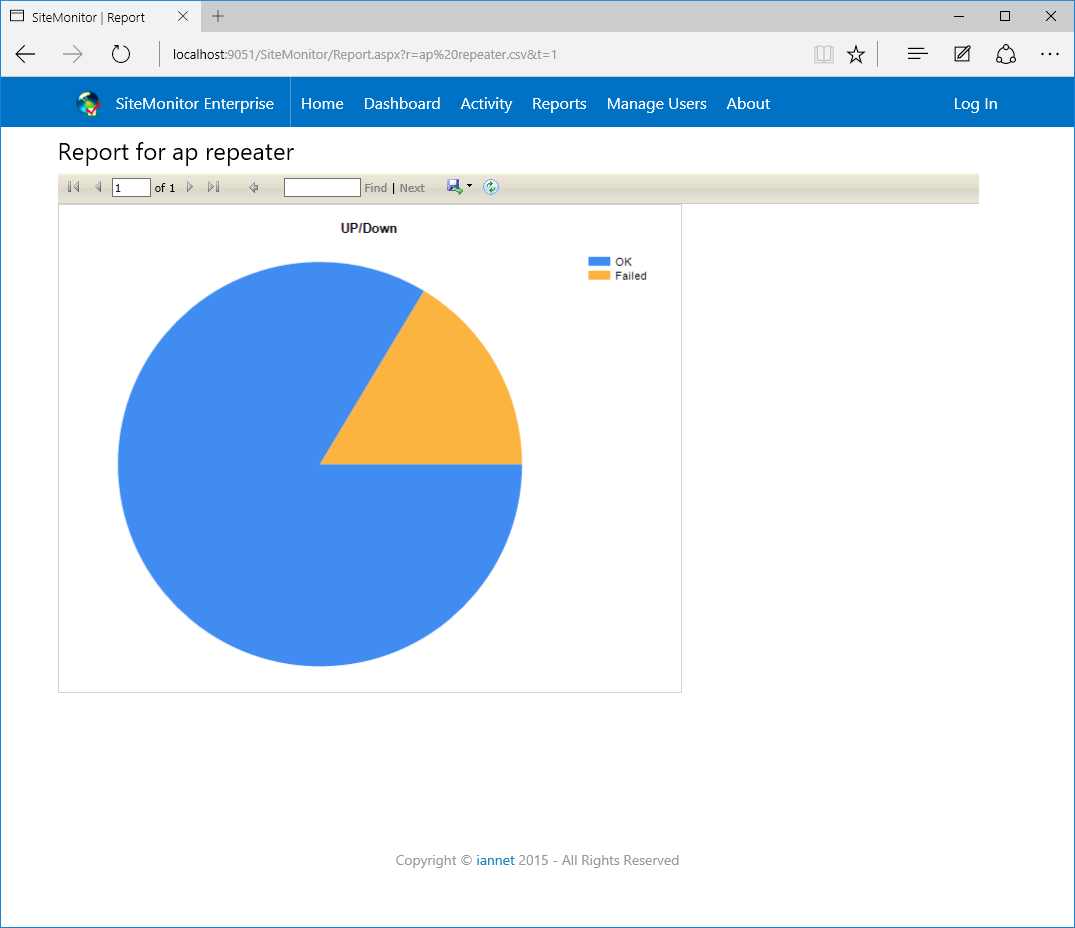
- UP/Down Report

Up Down Report
- This report gives you a quick overview of your website availability. It shows a pie chart with the uptime and downtime percentages.
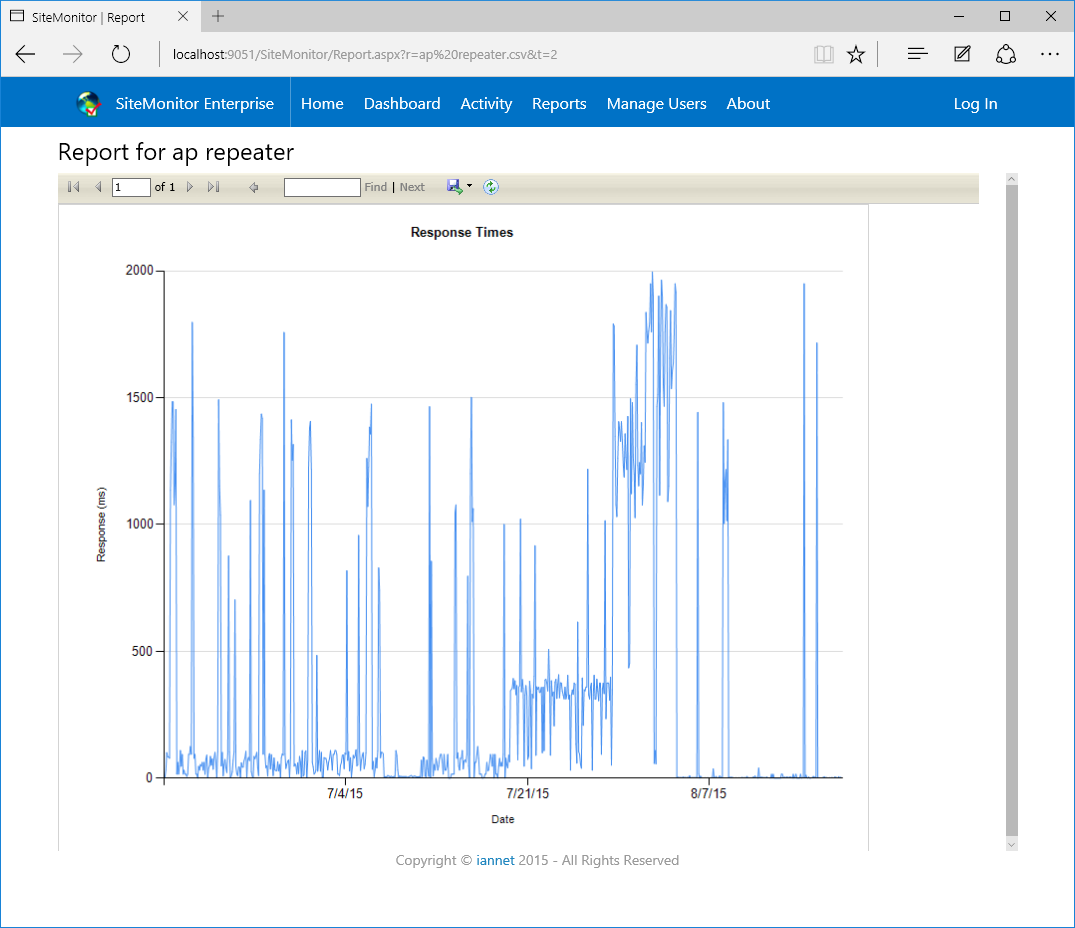
- Response Time
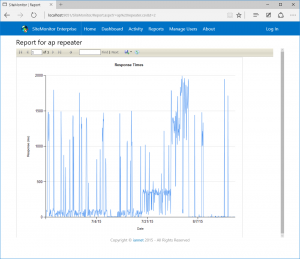
Response Time Report
- A website with lower response times is faster and better for visitors since they do not need to wait for content. This report shows a line chart with the response times. You can monitor to see days when the time was highest indicating a significant amount of load on the website.
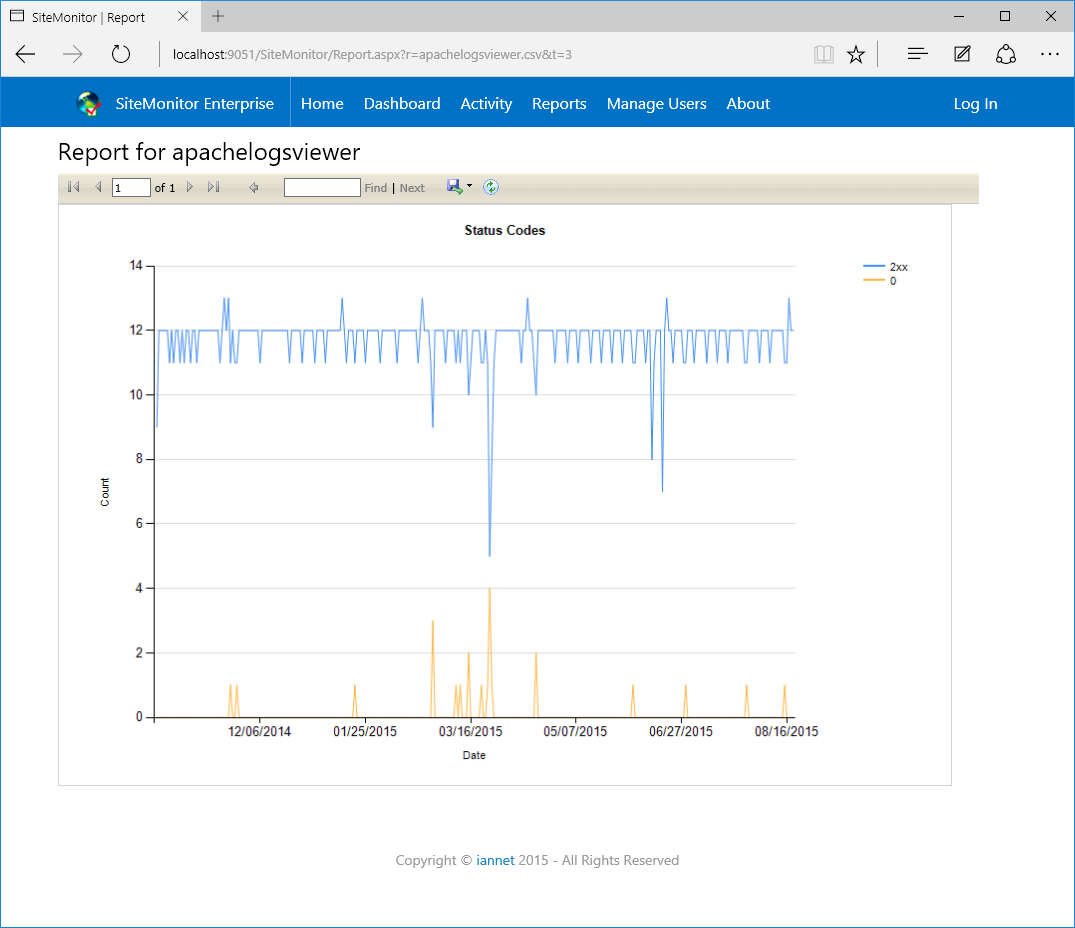
- Status Codes per Day

Status Codes per Day
- A line chart with different lines one for each status code. All codes should be ideally in the 2xx range indicating success. 3xx typically depict redirects, 4xx are client errors typically indicating clients requesting wrong resources and 5xx indicating issues and errors from the web server.
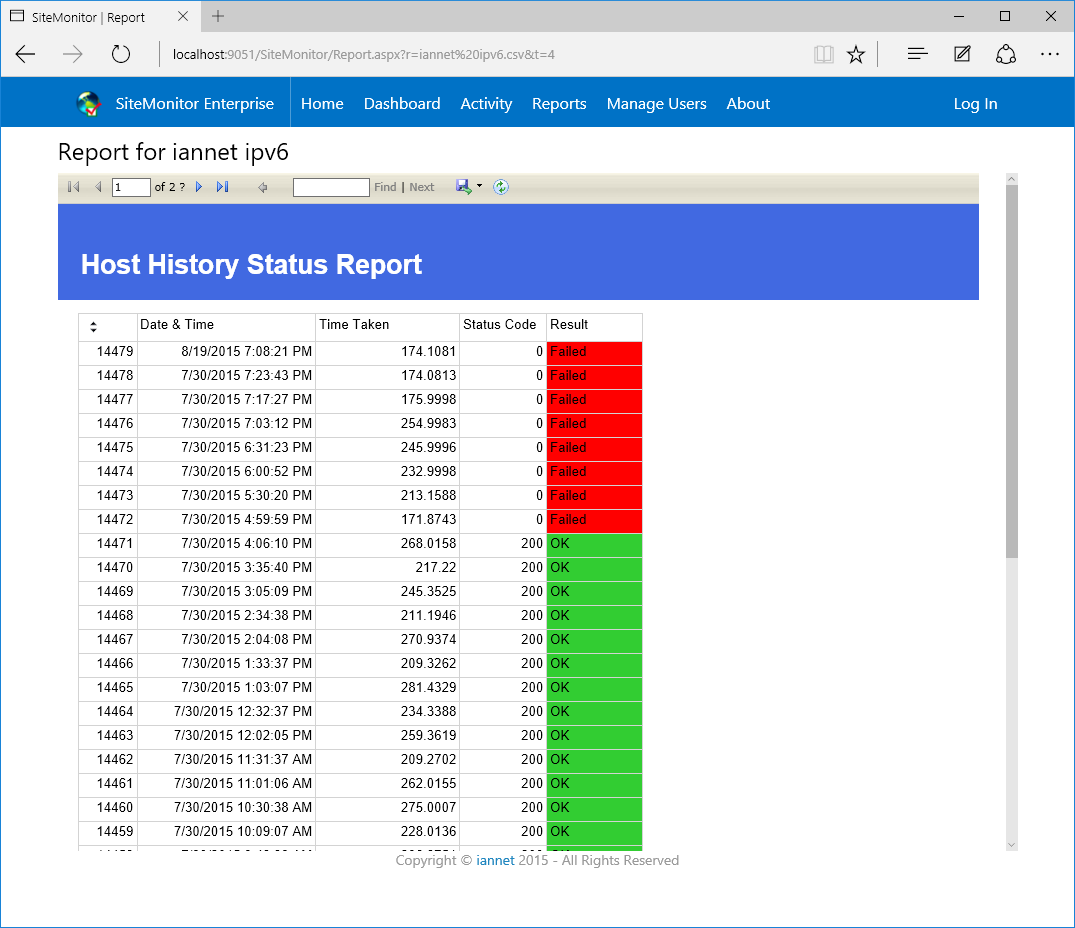
- Host History Status Report
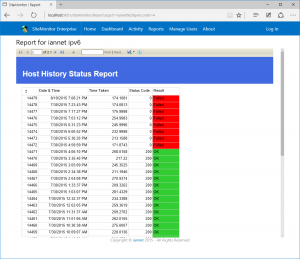
Status Report
- A table report with the history reporting data.
- Host History Failed Report
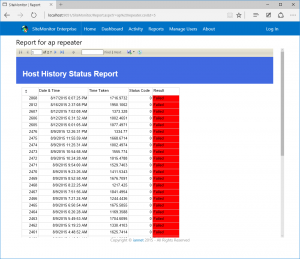
Failed Report
- A table report with the history reporting data that resulted in a failure.

- Host History OK Report
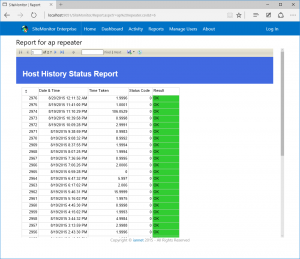
OK Report
- A table report with the history reporting data that was a success.

All reporting data can be exported to a PDF, Excel or Word document formats, ideal for further analysis.